Is HBAR the Next Big Opportunity? Price Drop Insights
HBAR has dropped over 30% this November. Dive into the latest price dynamics and discover what it means for your trading strategy.
The cryptocurrency landscape has seen intense fluctuations, and HBAR is no exception. Recent price movements show that HBAR has experienced a drop of over 30% this November 2023, with a market cap currently sitting at $1.5 billion and a trading volume clocking in at $75 million.
Understanding HBAR's price dynamics is crucial for you as traders, especially if you're focused on meme coins. This analysis will cover key insights, actionable strategies, and comparisons with other altcoins, aiming to equip you with the knowledge needed in this ever-evolving market.
🎯 KEY INSIGHT
As of November 2023, HBAR has witnessed a drop of 30%, but based on historical performance and market sentiment, a recovery of 40% is being targeted.
HBAR is the native cryptocurrency of the Hedera Hashgraph platform, celebrated for its unique consensus mechanism that enables fast, secure, and scalable transactions. Unlike traditional blockchains, Hedera operates on a Directed Acyclic Graph (DAG) structure, giving it a potential competitive edge over more established platforms like Ethereum.
In recent months, HBAR's price has fluctuated significantly, driven by broader market trends. The price dropped from $0.12 to $0.084, marking a decline of about 30%. When you observe trading volume and market cap, it’s clear that volatility remains a critical factor to keep an eye on.
Using sentiment analysis tools, such as the Fear and Greed Index, can provide valuable insights into trader emotions. Currently, the market sentiment leans towards fear, which affects HBAR’s potential for a rally. Understanding these emotions can help guide your investment decisions.
For you as traders, identifying crucial price levels is essential. HBAR's support hovers around $0.080, while resistance sits at $0.115. Keeping an eye on these levels can aid in making informed trading decisions.
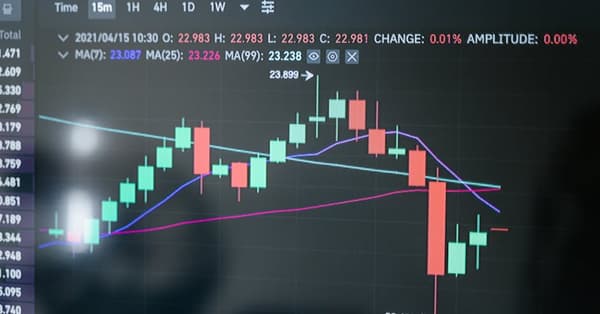
Chart patterns like the Bullish Flag or Ascending Triangle often signal potential price movements. For altcoins, recognizing these patterns can set the stage for strategic entry points and target prices.
Utilizing key technical indicators such as the RSI (Relative Strength Index) and MACD (Moving Average Convergence Divergence) can significantly aid your decision-making process. Currently, HBAR's RSI sits at 35, indicating a potential for a rebound.
[link: broader market context]
Tags:
Ready to Make Profitable Crypto Calls?
Check out our proven track record on the leaderboard
View Leaderboard →Related Posts
What the 3.8 Million BTC Lawsuit Means for Traders
A legal battle over dormant Bitcoin could shake the market. Discover what this means for you as a trader and the potential implications ahead.
Crypto Downturn: Understanding Meme Coins in a Dipping Market
The crypto market is turbulent. Join us as we analyze current trends and the role of meme coins amidst recent downturns. Let’s navigate this together!
Meme Coins Reignite: Your Guide to 2023's Hottest Tokens
Curious about the meme coin resurgence? Discover the latest tokens and trading strategies that are capturing the crypto community's attention this year.
Bitcoin's Weekend Surge: Meme Coins and 24/7 Trading Insights
Curious about the latest crypto trends? Discover how Bitcoin and meme coins are reshaping trading habits and what 24/7 trading means for you.
Mastering Meme Coins: Smart Trading on Solana & BSC
Looking to profit from meme coins? Discover effective trading strategies on Solana and BSC that can help you navigate this dynamic market.
Bitcoin ETF Outflow: What It Means for Meme Coins
BlackRock's massive Bitcoin ETF outflow has traders on edge. Discover the implications for Bitcoin and emerging meme coins in this must-read analysis.