Meme Coins Surge: What Every Trader Should Know
Discover the explosive rise of meme coins in December 2023. Learn key chart analysis tips to navigate this fast-paced market like a pro.
The cryptocurrency market is an ever-evolving landscape, and lately, meme coins have really taken the spotlight—especially on platforms like Solana and Binance Smart Chain (BSC). In December 2023, meme coins saw an astonishing average trading volume spike of 150%, showcasing their explosive popularity and the unique dynamics at play.
Understanding chart analysis is crucial in this fast-paced market, where meme coins can fluctuate wildly in price. As a professional crypto trader, you know that those who grasp charting techniques can seize opportunities that others might miss.
This article will equip you with key strategies for reading charts specifically tailored for meme coins, offer practical steps for developing your trading strategies, and present real-world examples to enhance your learning experience. So, let’s dive in!

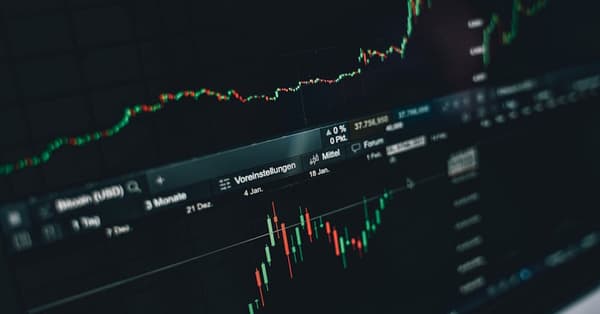
Cryptocurrency charts are graphical representations of price movements over time, playing a vital role in your trading decisions. The main types of charts include line charts, candlestick charts, and bar charts—each offering unique insights into market behavior.
Key technical indicators like moving averages, Relative Strength Index (RSI), and Moving Average Convergence Divergence (MACD) are essential for interpreting these charts effectively. [link: technical indicators]
Meme coins often exhibit unique chart patterns due to their sensitivity to social media trends and market sentiment. Historically, during price surges, meme coins like Dogecoin and PEPE have shown consistent chart patterns that savvy traders can leverage for profit.
Candlestick patterns provide a visual representation of price action. Each candle's body, wicks, and colors signify different market dynamics, with green indicating upward movement and red indicating downward movement.
Recognizing bullish and bearish patterns is crucial for making informed decisions. Patterns like the Doji and Engulfing signify potential reversals, so keep an eye on those. Remember, volume is critical in confirming these patterns.
🎯 KEY INSIGHT
Analyzing PEPE's candlestick patterns revealed a jaw-dropping 340% pump within just 48 hours, clearly illustrating the power of... [link: meme coin analysis]