XRP's Volatility: Are Meme Coins the Key to Profits?
Discover how XRP's recent swings mirror meme coins like BONK and PEPE. Dive into market dynamics to enhance your trading strategy.
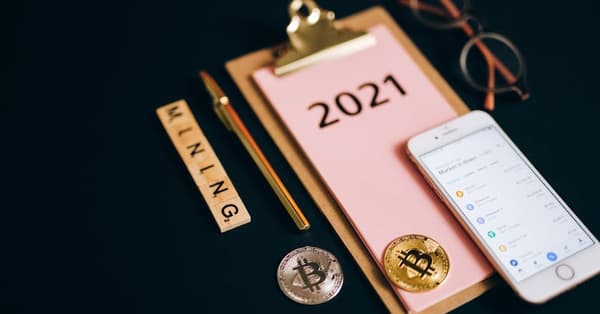
The meme coin trend has taken the crypto market by storm, captivating investors with explosive growth potential. Recently, XRP has demonstrated surprising volatility, aligning with trends seen in popular meme coins like BONK and PEPE, which saw their value surge by an astonishing 340% in just 24 hours.
To maximize your returns, understanding market dynamics is crucial. This comprehensive analysis will delve into XRP's market position and offer you actionable trading strategies.
🎯 KEY INSIGHT

As of October 2023, XRP's market cap is approximately $22 billion, placing it among the top cryptocurrencies, while meme coins like BONK and PEPE hover around $300 million and $250 million, respectively.
In recent days, XRP has fluctuated between $1.3786 and $1.5074, showcasing a robust trading environment. Keep an eye on the key resistance level at $1.4620, while $1.440 serves as vital support.
When you compare XRP to meme coins like BONK and PEPE, the differences are striking. XRP's liquidity and longer establishment in the market offer a contrast to the high volatility typically seen in meme coins, which often exhibit more erratic trading volumes.
XRP’s established network positions it as a potential liquidity provider within the meme coin ecosystem, complementing newer projects. Its scalability and regulatory clarity might attract seasoned traders looking to shift from speculative meme coins.
For you, critical price levels for XRP are essential. A break above the $1.4620 resistance could signal bullish momentum, while a dip below $1.440 might lead to further losses.
The current bullish trend line suggests potential upward movement, bolstered by indicators like the MACD and RSI, which are currently hovering near the 70% mark. This indicates XRP is nearing overbought territory.
Applying Fibonacci analysis, the 38.2% and 61.8% levels are critical for determining potential reversal points. Be sure to keep a close watch on these levels as you navigate your trading decisions.
Tags:
Ready to Make Profitable Crypto Calls?
Check out our proven track record on the leaderboard
View Leaderboard →Related Posts
What the 3.8 Million BTC Lawsuit Means for Traders
A legal battle over dormant Bitcoin could shake the market. Discover what this means for you as a trader and the potential implications ahead.
Crypto Downturn: Understanding Meme Coins in a Dipping Market
The crypto market is turbulent. Join us as we analyze current trends and the role of meme coins amidst recent downturns. Let’s navigate this together!
Meme Coins Reignite: Your Guide to 2023's Hottest Tokens
Curious about the meme coin resurgence? Discover the latest tokens and trading strategies that are capturing the crypto community's attention this year.
Bitcoin's Weekend Surge: Meme Coins and 24/7 Trading Insights
Curious about the latest crypto trends? Discover how Bitcoin and meme coins are reshaping trading habits and what 24/7 trading means for you.
Mastering Meme Coins: Smart Trading on Solana & BSC
Looking to profit from meme coins? Discover effective trading strategies on Solana and BSC that can help you navigate this dynamic market.
Bitcoin ETF Outflow: What It Means for Meme Coins
BlackRock's massive Bitcoin ETF outflow has traders on edge. Discover the implications for Bitcoin and emerging meme coins in this must-read analysis.